
Instructions
Action 1Use the Draw a Polygon ( ) feature to outline the subsurface-drained area served by a single outlet.
Proceed to next step.
Edit the streams and watersheds using the utilities in the bottom-right corner.
Instructions
Action 1Use the Draw a Polygon () feature to outline the subsurface-drained area served by a single outlet.
Use the Draw a Marker ( ) feature to identify the location of the outlet control structure.
Use the Draw a Polyline ( ) feature to identify the main pipe.
Enter values in the table and proceed to Step 3 to view the impacted area.
| Impact Area Determination Method | |
| User-specified elevation rise |
Instructions
Action 1Use the Draw a Polygon () feature to outline the subsurface-drained area served by a single outlet.
Use the Draw a Polyline () feature to identify the length of the distribution pipe.
Use the Draw a Marker () feature to identify the location of the outlet control structure.
Enter values in the table and click Generate Profile. A Passed Design is required to proceed.
| Depth of distribution pipe (ft) | |
| Minimum allowable depth (ft) | |
| Maximum allowable depth (ft) | |
| Pipe location relative to structure | |
| Grade of distribution pipe (%) | |
| Grade of pipe: start to structure (%) | |
| Grade of pipe: structure to end (%) |
1b. Manual Soil Inputs
 |
2. Cropping System Info
| Cropping system | | ||||
| Corn planting date | |
Will you use no-till? | | ||
| Corn growing days | | ||||
| Soybean planting date | | ||||
| Soybean growing days | |
3. Drainage System Properties
Drainage Design
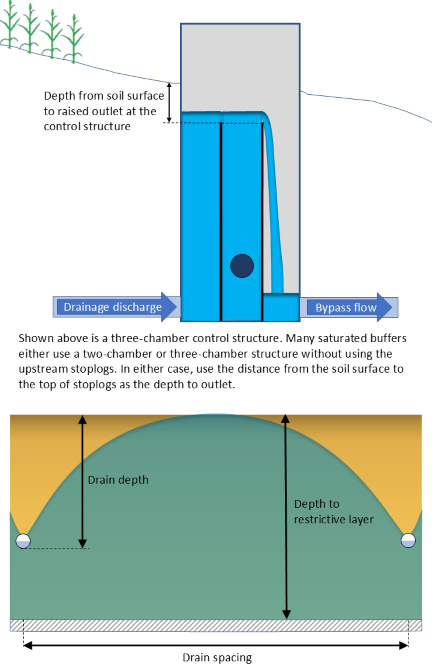
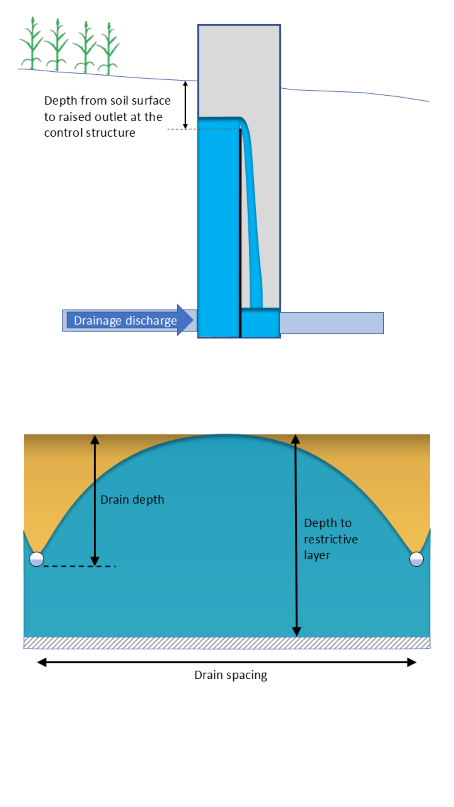
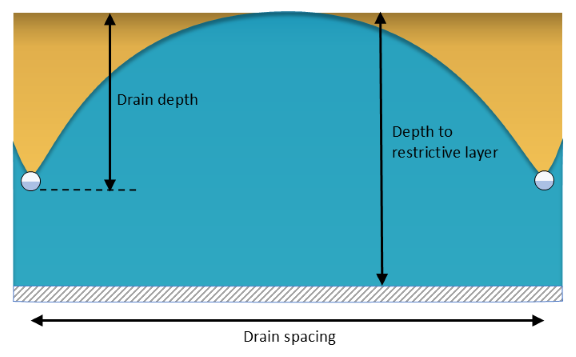
| Drain depth (ft) | | |
| Drain spacing (ft) | ||
| Size & type of lateral drain pipe | | |
| Drainage coefficient (in/day) | |
| Will you split runs? | ||
| Existing drain spacing (ft) | ||
| Existing drainage coefficient (in/day) | |
Outlet Management Settings
| Corn | Soybean | ||
|---|---|---|---|
Preparing for spring planting | |||
| Date to lower outlet elevation before planting | | ||
Management during growing season | |||
| Depth from soil surface to raised outlet (in) | |||
| Date to raise outlet elevation after planting | | ||
Preparing for fall harvest | |||
| Date to lower outlet elevation before harvest | | ||
Management during non-growing season | |||
| Depth from soil surface to raised outlet (in) | |||
| Date to raise outlet elevation after harvest | | ||
Check box to maintain a constant weir setting year-round | |||
Action: Click on the Generate Profile button. A Passed Design is required to proceed.
Optional: Click on the Generate Profile button to see the weir profile.

Please wait while the profile is generated.

4. Simulation Period
Weather data is available from the year 1981 onward (a minimum of 30 years is recommended)
| Simulation start year | |
| Simulation end year | |
| Length of simulation period (years) |
5. System Cost
| Drainage System and Maintenance Costs | |
|---|---|
| Material cost of lateral drain pipe ($/ft) | |
| Installation cost of lateral drain pipe ($/ft) | |
| Expected lifetime of drainage system (years) | |
| Interest rate on average investment per year (%) | |
| Maintenance rate per year (%) | |
| Crop Information for the Subsurface-drained Farm | ||
|---|---|---|
| Corn price ($/bu) | | |
| Soybean price ($/bu) | | |
| Potential corn yield (bu/ac) | | |
| Potential soybean yield (bu/ac) | | |
| Annual corn production cost ($/ac) | | |
| Annual soybean production cost ($/ac) | | |
| Controlled Drainage Costs | |
|---|---|
| Material, freight, and installation cost of control structure ($) | |
| Expected lifetime of the control structure (years) | |
| Interest rate on average investment per year (%) | |
| Maintenance rate per year (%) | |
| Select the Financial Incentives to be Included | |
|---|---|
| Water Quality Information/th> | ||
|---|---|---|
| Average annual nitrate-N concentration in drainage discharge (mg/L) | | |
5. Saturated Buffer Properties
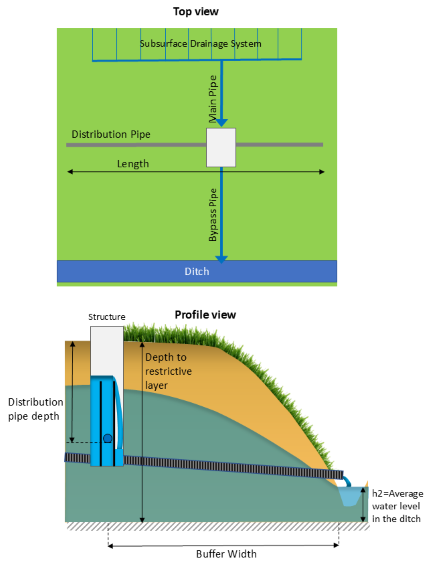
| Length of distribution pipe (ft) | | |
| Maximum buffer width (ft) | | |
| Existing buffer width (ft) | | |
| Depth of distribution pipe (ft) | | |
| Size of main pipe connecting field drainage to structure (in) | | |
| Average water level in the ditch, h2 (ft) | | |
| Equivalent saturated hydraulic conductivity of the buffer soil (in/h) | | |
| Depth to restrictive layer of the buffer soil (ft) | | |
| Effective porosity of the buffer soil (decimal) | | |
| Size & type of distribution pipe | | |
| First-order denitrification coefficient of the buffer soil, Kd (day-1) | |
6. Saturated Buffer Cost
| Saturated buffer system and maintenance costs | |
|---|---|
| Material, freight, and installation cost of control structure ($) | |
| Material and installation cost of distribution pipe ($/ft) | |
| Cost of grass seed and its drilling ($/ac) | |
| Expected lifetime of the saturated buffer system (years) | |
| Interest rate on average investment (%) | |
| Maintenance rate, adjusting/replacing stoplogs, grass moving/baling (%) | |
| Select the Financial Incentives to be Included | |
|---|---|
| Water Quality Information | ||
|---|---|---|
| Average annual nitrate-N concentration in drainage discharge (mg/L) | | |