The chart application visualizes up to 4 data sources over time using charts.
Visualize Data
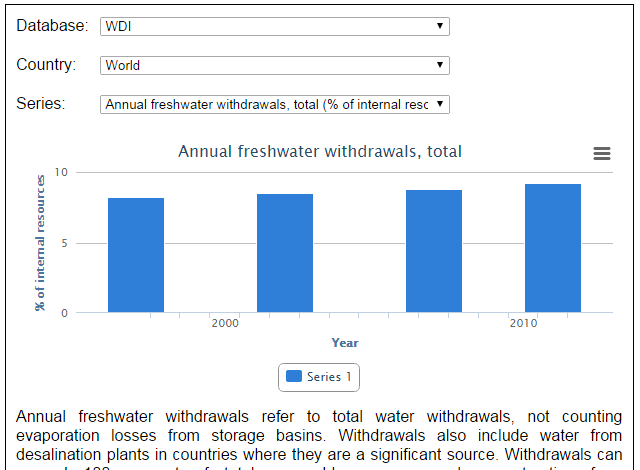
Step 1
Choose a database, country and series. This data will be displayed on the corresponding chart. You can view more information about this data below the chart.
Step 2
To compare data between charts, repeat step 1 for the other charts on the page.
Step 3
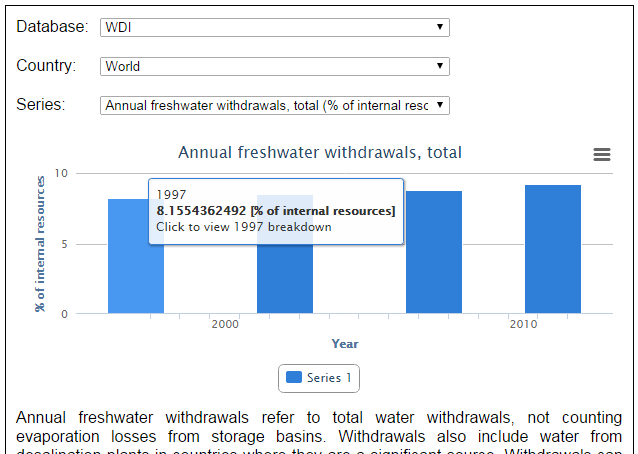
To view more detailed information on a specific year, click on the corresponding bar in the chart. To return to the overview, click a bar in the chart.
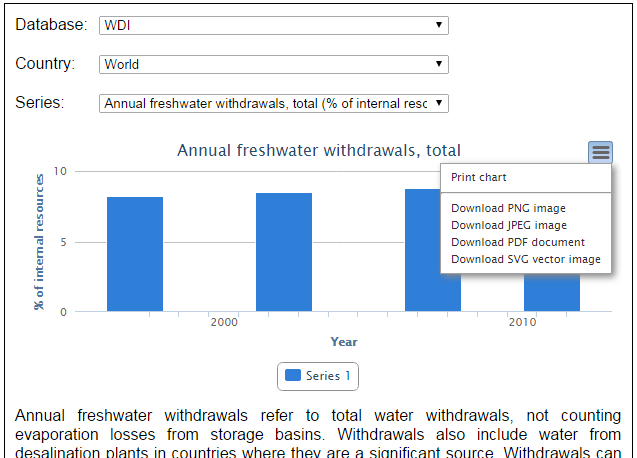
Step 4
To print this chart or export it to an image file, click on the menu button and click on the corresponding action in the menu.